Trading the EURUSD – April 2016 and Beyond
 I believe the current multi-monthly consolidation pattern on EURUSD is nearing its end, with potential for a breakout to occur in 2016. For now, the EURUSD remains in a broad symmetrical triangle pattern from the 2015 low of 1.0461 and 2015 high 1.1712.
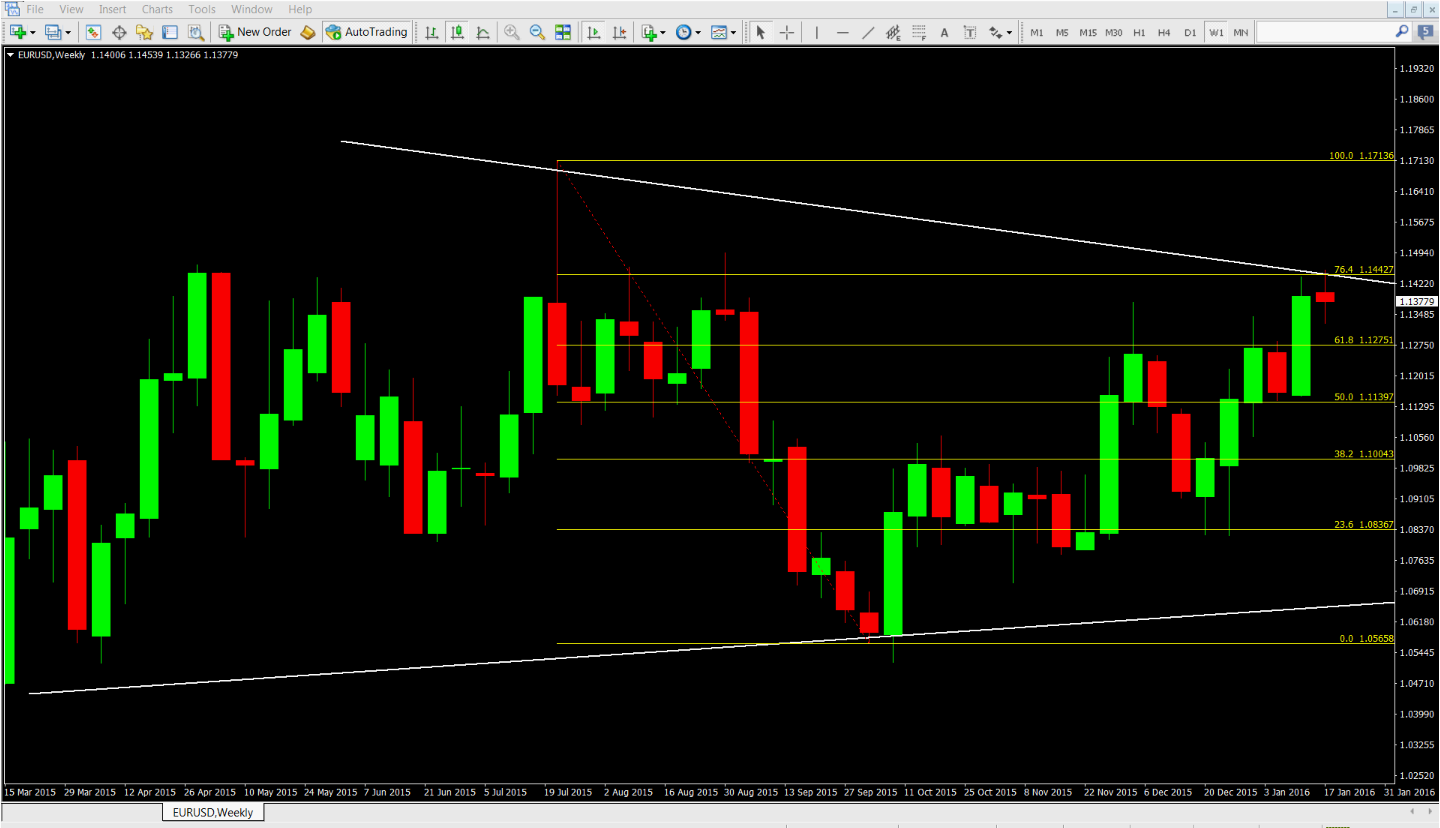
Symmetrical triangle pattern on a weekly EURUSD chart. CLICK ON CHART TO VIEW FULL SIZE
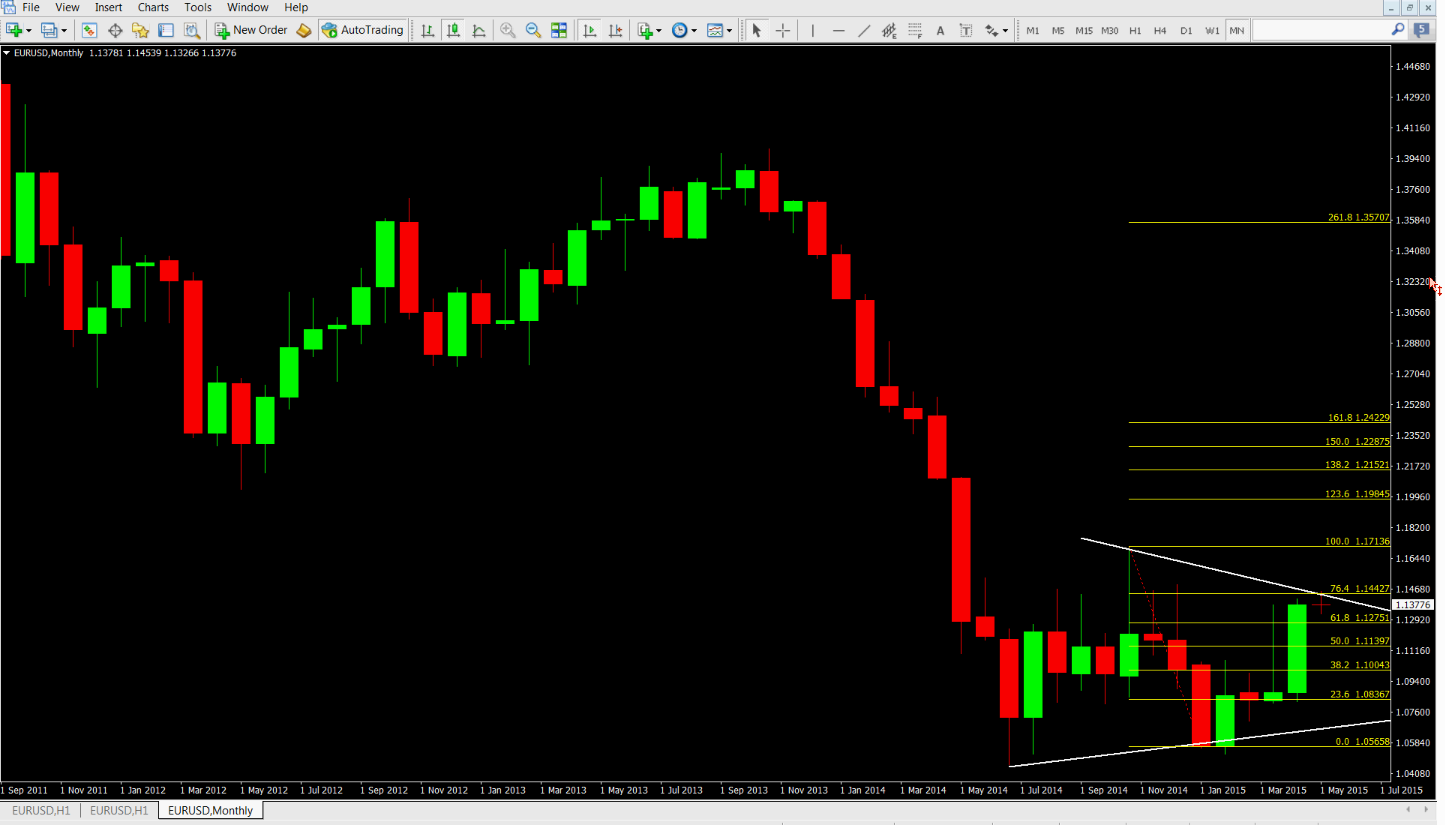
Symmetrical triangle pattern on a monthly EURUSD chart. CLICK ON CHART TO VIEW FULL SIZE
On the upside, look for a monthly open and higher close above the 1.1712-1.1342 descending trend line, followed by a weekly open and higher close above the 76.4 of the 1.1712-1.0522 decline at 1.1432 to confirm the upside break is targeting 1.171,2 followed by 1.1994(123.6 of the 1.1712-1.0522).
As to the downside, look for a monthly open and lower close below the 23.6 of the 1.1712-1.0522 decline at 1.0804 to confirm downside extension is underway initially targeting 1.0522 followed 1.0327.
This will be discussed in my free webinar event on April 12, 2016.
Below I have listed essential triangle or symmetrical triangle pattern criteria, all of which apply to the current pattern witnessed on the monthly EURUSD chart.
Trend
In order to qualify as a symmetrical pattern, an established trend should exist. The prior trend should be several months old, and the symmetrical triangle marks a consolidation period before continuation or trend reversal.
4 Points
At least 2 points are required to form a trend line and two trend lines are required to form a triangle, however, 3 points per trend line is needed to confirm. Therefore, a minimum of 4 points are required to begin considering a formation as a triangle. Ideally, the breakout occurs after 6 points (3 on each side). At this writing there are 4 lower points and 3 upper points.
Volume
As the triangle extends and the trading range contracts, volume begins to diminish. Such has been the case the last few weeks. This is known as the quiet before the storm, or the tightening consolidation before the breakout.
Duration
The triangle can extend for a few days to a few months and is directly related to the recent trend. The strength and momentum of the subsequent breakout is directly proportionate to the duration of the symmetrical pattern. The current pattern as a duration of several months as a strong trend will likely follow once the breakout occurs.
Breakout Time Frame
The ideal breakout point occurs 1/2 to 3/4 of the way through the pattern’s development or time-span. The time-span of the pattern can be measured from convergence of upper and lower lines. A break before the 1/2-way point might be premature and often a false break. Most breakouts occur after 2/3 of the pattern is complete.
Breakout Direction
The future direction of the breakout can only be determined after the break has occurred, thus when such breakouts do occur the resulting extension will be supported by strong trend dynamics.
Breakout Confirmation
For a break to be considered valid, it should be on a closing basis with a price (3% break) or time (sustained for 3 days) filter to confirm validity. However, in that the current pattern duration is more than several months in duration, a monthly open and close outside the pattern will be required to confirm the break. Additionally, as the breakout unfolds, an expansion in volume and momentum will occur. As often occurs, once prices break above or below the trend lines, a retest of the trend lines as support or resistance usually follows, thus allowing opportunity to enter a position once the breakout is confirmed.
Return to Apex
After the breakout (up or down), the apex can turn into future support or resistance. The price sometimes returns to the apex or a support/resistance level around the breakout before resuming in the direction of the breakout.
Price Target
There are three methods to estimate the extent of the move after the breakout. First, the widest distance of the triangle can be measured and applied to the breakout point. Second, a trend line can be drawn parallel to the pattern’s trend line that slopes (up or down) in the direction of the break. The extension of this line will mark a potential breakout target. The third and preferred method is the Active Wave Theory. For an upside break, use the 1.1712-1.0522 wave to forecast upside targets of 123.6, 138.2, 150.0 and 161.8. For the downside, use the 1.0522 rise once that wave is complete, as defined by a monthly open and lower close below the 38.2 of the 1.0522 rise. At this writing, the rise from 1.0522 remains active with continued risk for further upside extension.
Join Our Trading Room
I am in our Forex Live Trading room daily, actively trading not just the EURUSD but all the USD major pairs. I hope you’ll join me as we navigate through the Forex waters and look forward to an exciting and profitable quarter ahead.
- Posted by adminfx
- On April 8, 2016
- 0 Comments
0 Comments